Introduction
The study of Osmium isotopes is an important tool in geochemistry and cosmochemistry (e.g. Shirey and Walker 1998, Brandon et al. 2006, Ravizza and Turekian 1992). Side box 1 provides background on the two Os isotope systems of interest.
Whilst 187Os/188Os ratios can vary by several percent, the variation in 186Os/188Os is far smaller – a few hundred ppm. Consequently any meaningful 186Os/188Os measurements must be capable of attaining a precision of ~ 20ppm (2SRSD). For Faradays this implies a 186Os beam intensity of 100mv or more.
Phoenix TIMS
We present here the first high precision Osmium isotope ratio data from the Phoenix Thermal Ionization Mass Spectrometer.
Side box 2 provides details of the NTIMS methodology used. The aim of the study was to provide a performance baseline using a standard Phoenix instrument situated in a factory environment. There was no temperature or environmental control.
New Developments
Phoenix includes three specific developments which make these measurements possible:-
- A newly designed focus unit which can analyse negative ions at up to -8KV. -6KV was used throughout this work as it did not reduce the sensitivity.
- Small Al-Ni-Co magnets have been fitted to one of the side filament (Figure 1). This facilitates the repulsion of electrons as close as possible to the filament. Large electron beams can produce irregularities in the peak shape and potentially a high voltage flashover.
- A targeted oxygen bleed system which directs oxygen immediately adjacent to the sample bead holder.

1. Os Isotopes
Two decay schemes are important in Os isotope analysis.
- 187Re decays to 187Os with a half life ~42 Gyr.
- 190Pt decays to 186Os with a half life ~ 470 Gyr.
187Os and 186Os are quoted as a ratio against stable 188Os
Re/Os – Re is enriched in the crust relative to the mantle leading to wide variations in 187Os/186Os of surface rocks. Low Os concentrations and complex chemistry prior to NTIMS analysis remain major challenges.
Pt/Os – The extremely long half life of 190Pt and a comparatively narrow range in Pt/Os means that even small variations in 186Os/188Os are significant. Very high measurement precision is therefore required.
2. NTIMS Analysis
Osmium is measured by TIMS as a the negatively ionized OsO3¯ molecular species. This is because the ionization potential of Osmium is so high that it would evaporate before Os+ ions could form (Creaser et. al 1991). Osmium has a high electron affinity, and will readily combine with O- . The formation of OsO3¯ requires a high work function filament (Platinum), and a low work function activator Ba(NO3¯)2 or Ba(OH)2 or a combination. The activator covers the Osmium on the filament and during thermal ionization it disassociates to combine the O- with Os. Formation of OsO3¯ is also facilitated by bleeding a very small quantity of Oxygen close to the sample filament. Addition of oxygen from the bleed system raises the source vacuum from 1e-8mbar to 2e-7mbar. The small magnet placed next to the Pt filament deflects electrons away from the mass spectrometer lens stack, thereby ensuring focus continuity over a range of filament currents.
Peak Shape Stability
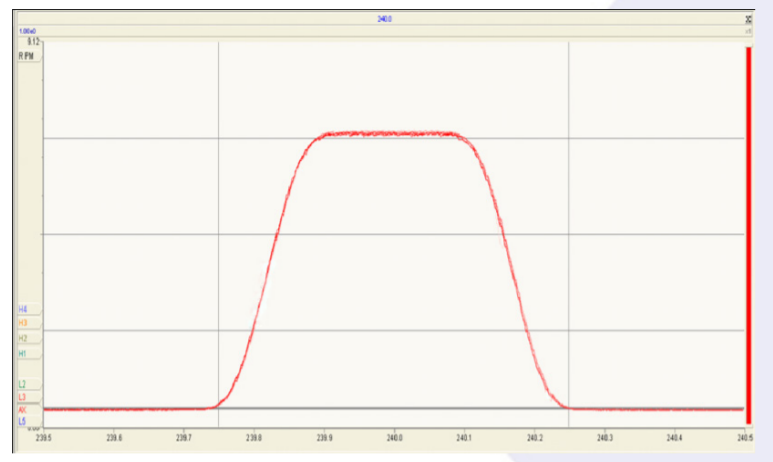
Figure 2 shows a magnet scan over 192OsO3¯ (the major Os oxide isotope peak at mass 240) repeated continuously for 45 minutes. The quality and stability of the peak shape highlights the performance of the new focusing electronics. The peak side stability was better than 10ppm of mass over the 45 minutes.
OsO3 ¯ Coincidence
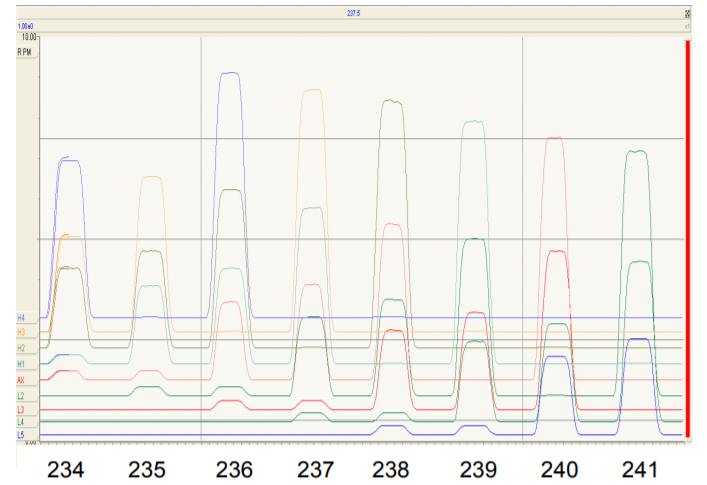
Figure 3 shows a magnet scan from m/z 233.5 to m/z 241.5 (referenced to axial collector) showing the response of all 9 Faradays on one diagram. For this scan all 9 Faradays have been set to the equivalent of 1 AMU spacing for OsO3¯
At the extreme left hand side of the figure the traces for the 5 channels from Axial to H4 show coincidence of peaks from m/z 234 (predominantly 186OsO3 ¯) up to m/z 238 (predominantly 190OsO3 ¯). At this point the L5 Faraday is collecting m/z 230 (182WO3 ¯) although none is evident.
On the extreme right of Figure 3, mass 241 is on the Axial collector, mass 245 is on H4 and mass 237 (189OsO3¯) is on the L5 Faraday. Hence with its 9 Faradays set to OsO3¯ spacing, Phoenix can achieve coincidence on isotopes from m/z 230 to m/z 245.
Multi-static analysis
We have adopted a 4 cycle multi-static analysis routine as shown in Table 1. Multi-static is a new acquisition method currently under investigation at Isotopx.
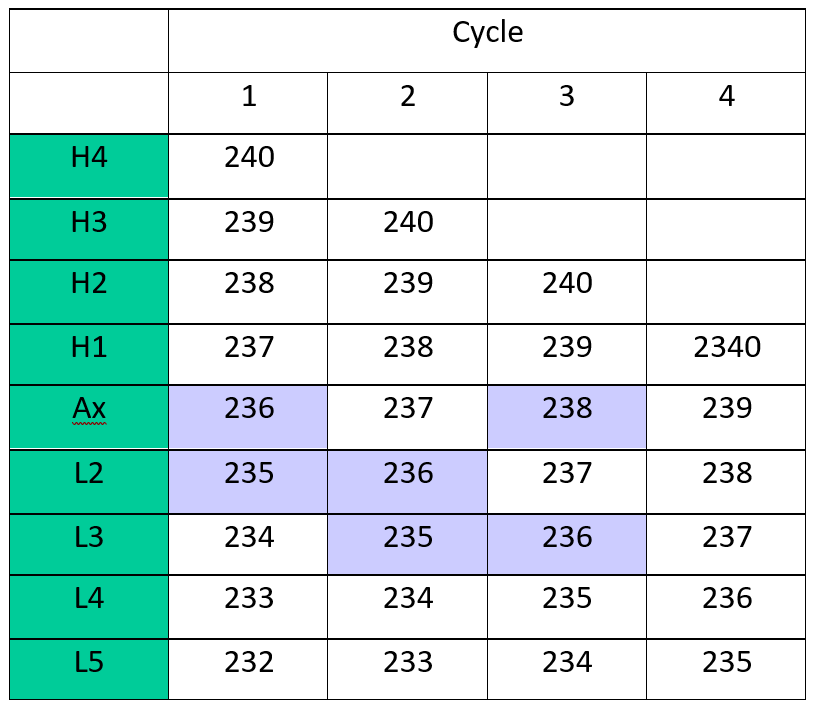
Multi-dynamic remains the gold standard mode as it eliminates any variations in collector efficiency or amplifier gain drift. The multidynamic method requires that normalizing isotopes are measured on the same collectors as the isotope ratios of interest. This requires the normalizing isotopes to be closely matched in mass to the isotopes of interest. For example a true multidynamic analysis which cancels all collector gains and efficiencies could be made for 235/236 (187Os/186Os) in cycle 1 and 2 (highlighted on Table 1) using a mass fractionation correction from 238/236 (190Os/188Os) in cycle 3.
However, the current consensus is that mass fractionation should use the stable isotope ratio pair with the largest mass difference, i.e. 240/236 (190OsO3¯/186OsO3¯) as this produces more precise normalised osmium isotope ratios (Brandon et. al. 2006). It is evident from Table 1 that (for example) the 235/236 does not have a multi-dynamic solution using mass fractionation correcting with 240/236.
The multi-static approach is relatively simple. Static ratios are measured in each collector pair, an average is calculated and a fractionation correction applied using the average 240/236 ratio from each of the 4 sequences.
The method provides partial cancellation of gain and collector efficiency variations by measuring the same isotope ratios on different collector pairs. A rigorous comparison with multidynamic analysis is under investigation as the methodology will have application to other isotope systems such as Nd and Sr.
Sample loading Method
Two samples were used. An Osmium Standard kindly provided by Dr. Richard Walker from the University of Maryland, and an ICP Osmium standard from Alfa chemicals.
Both samples were in an HCl matrix. Sample sizes for the UMd standard were typically 140ng, while the Alfa standard was 500ng.
Samples were loaded onto Platinum ribbon and dried down with no filament current. 2 microlitres of Barium hydroxide was placed onto the Osmium and dried down at 1A.
Mass Spectrometry
The filament current was increased steadily to 2 Amps over the course of 2 hours. The 35Cl isotope was monitored until it had grown to ~6 volts. At this stage the Osmium ion beam started to appear. The filament current was then raised slowly over the course of 1 hour to ~2.4A, by this time the Osmium ion signal had grown to >3volts.
Data collection started at ~720C and continued for 150 cycles. Each cycle consisted of 4 mass jumps with an integration of 15 seconds for each mass. Baselines were taken at the start of each block. These were measured for 30 seconds at 0.5amu either side of the peak. The ion beam was focussed and peak centred at the start of each block of data. Generally the ion beam remained steady during the course of the measurement with no requirement to increase the filament current.
During the measurement, oxygen was bled into the source of the Phoenix to provide a source vacuum of 2e-7 mbar. The base source vacuum was <1e-8 mbar, no cryo-cooling of the source was required. Analyser vacuum remained at <5e-9 mbar during this process. Each analysis took ~ 6 hours, with data collection taking 50% of the time.
Following correction for 187Re on 187Os, all the isotopes were corrected for oxygen isotopes. Side box 3 provides details on the O2 correction used. The corrected ratios were then fractionation corrected using an exponential law and a 192Os/188Os ratio of 3.083,( Brandon et al. 2006).
Results
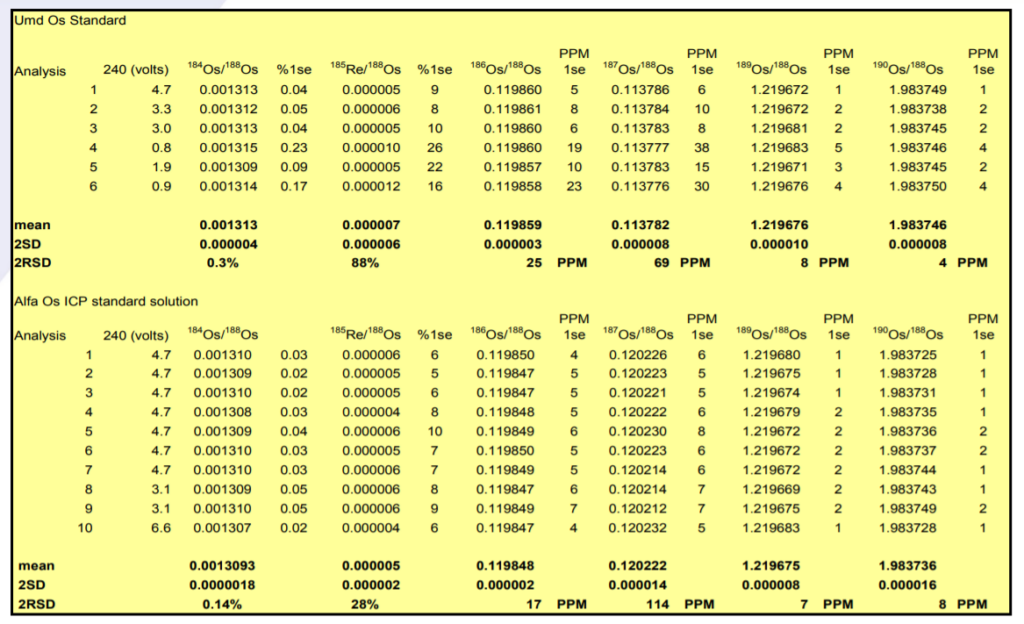
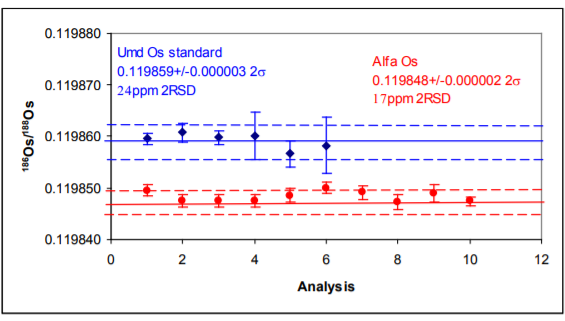
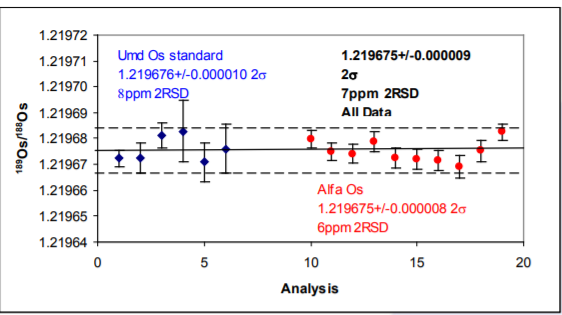
The results are shown in Table 3 and in Figures 4 and 5.
186Os/188Os – Results for both samples show excellent external precision in range 17-25ppm (2σ). Internal precision correlates with ion beam intensity (second column) with Consistently sub 10 ppm (2σ) for ion beams greater than 4V of 192Os.
189Os/188Os Provides an example of how precise the multistatic method is. Both samples produce the same isotope ratio. Ion beams are typically 1-2 volts for both isotopes and the ratio reproduces to 7ppm 2 RSD for all data. This precision cannot be obtained for single static isotope ratio measurements without performing an on-line amplifier calibration method. It can be obtained using a multi-dynamic method, but this is not possible using the 192Os/188Os mass fractionation correction.
Comparison with other studies
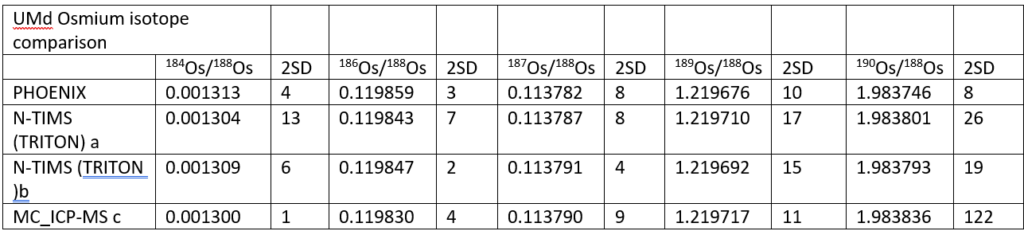
Table 2 shows a comparison between the UMd data collected in this study and in three other studies which used either NTIMS or ICP-MC-MS. (Luguet et. al 2008)
Although within the 2σ of the other NTIMS values, the Phoenix 184Os/188Os is slightly higher. It is definitely higher than the ICP-MC-MS value which is the lowest of all the datasets. This is perhaps consistent with a small but constant PtO2 interference being present beneath the 184OsO3¯ at mass 232 on NTIMS but not in the ICP. Since the 184 intensity is small (~1-2mv), even interferences at the microvolt level will have a significant effect. There is a suggestion within the data in Table 2 that 184Os/188Os and the beam intensity are negatively correlated which adds support to the suggestion of an uncorrected interference at mass 232.
The 186Os/188Os is higher for the Phoenix than the other studies. Reproducibility is as good as other the studies. The higher ratio could be due to an uncorrected 186W16O3¯ interference, but this would have to be very consistent and unlike the 184Os/188Os there is no suggestion of a correlation with ion beam intensity which may indicate that this interference is in the sample. It is noteworthy that the Alfa standard has a lower 186Os/188Os ratio though the Pt/Os history of this sample is not known.
We would also discount a collector efficiency or gain effect since these ratios were measured on multiple collector sets. Peak tailing (abundance sensitivity) can be excluded as analyser vacuum was always <5e-9mbar during analysis. This would give rise to an uncorrected peak tail of 5ppm of intensity of <5ppm at mass 237 with respect to 238, and <2ppm at mass 236 (184Os).
The 187Os/188Os is identical within error of other studies. Since the 187Os/188Os are measured on the same collectors as 186Os, the reason for the high 186Os is still unclear. 189Os/188Os is of higher precision than other TIMS studies, while the 190Os/188Os is about 2 times more precise. It is noteworthy that the 190Os/188Os is lower than the other studies, as is perhaps the 189Os/188Os. This may suggest that some of the discrepancy is due to subtleties in the mass fractionation correction, and that the exponential law is not quite correct. This has also been suggested by Luguet et.al, 2008. More data is required to confirm this.
3. Oxygen isotope corrections
Because the isotopes of osmium are measured as a tri-oxide species, accurate correction for 17O and 18O has to be made. These corrections have been described extensively elsewhere e.g. (Luguet et. al 2008). For this study a fixed oxygen ratio was used which had been determined from analysis of 242/240 and 241/240 on a separate series of analyses. It was found that the ratio was extremely stable over a period of a week and so a fixed value was used for the measurements presented here.
17O/16O = 0.0003881+/-0.0000025
18O/16O = 0.0020560+/-0.0000025
These ratios are similar to those reported by Luguet et. al 2008.
The analysis method used does allow for the continuous measurement and correction for oxygen isotopes, however large Osmium ion beams need to be maintained to prevent errors due to counting statistics on the oxygen isotope ratio propagating through the osmium isotopes. All Oxygen corrections were made online during the course of the measurement using the IonVantage software.
Summary
- High precision Osmium isotopes have been measured on the Phoenix TIMS at Isotopx in negative ion mode with the 2σ errors being comparable with the best literature values.
- 186Os/188Os precisions of ~20ppm 2RSD can be obtained providing there is sufficient ion beam.
- The multi-static analysis mode produces
References
Shirey, S. B. and Walker, R. J., 1998. The Re-Os isotope system in cosmochemistry and high temperature geochemistry. Annual Reviews Earth and Planetary Science Letters 26, 423-500.
Brandon, A.D.,Walker, R.J., Puchtel, I.S., 2006. Platinum–Os isotope evolution of the Earth’s mantle: constraints from chondrites and Os-rich alloys. Geochim. Cosmochim. Acta 70, 2093–2103
Ravizza, G. and Turekian, K.K., 1992. The Osmium isotopic composition of organic-rich marine sediments. Earth and Planetary Science Letters 110, 1-6.
Creaser, R. A., Papanastassiou, D. A., and Wasserburg, G. J., 1991. Negative thermal ion mass spectrometry of osmium, rhenium and iridium. Geochimica et Cosmochimica et Acta 55, 397-401.
Luguet, A., Nowell, G.M., Pearson, D.G., 2008. 184Os/188Os and 186Os/188Os measurements by negative thermal ionisation mass spectrometry (NTIMS): effects of interfering element and mass fractionation corrections on data accuracy and precision. Chem. Geol. 248, 342–362.
Download Application Note
Download the complete Application Note: High Precision Os on Phoenix X62 TIMS