Introduction
Until recently it was assumed that the terrestrial 235U/238U was 137.88. However high precision 235U/238U measurements using ICP multi collector mass spectrometers1 as well as double spiked TIMS have shown small variations in 235U/238U at the 1- 2 per mil level. In uranium ores these variations are possibly due to changes in environmental redux conditions2 . Variations in terrestrial minerals of >5 per mil have also been reported3 , the reasons for these variations is not known.
Whilst TIMS can detect these small variations in 235U/238U a very high quality correction of instrumental mass fractionation is required. Many elements e.g. Sr and Nd possess stable isotopes of known ratio which can be monitored during TIMS analysis and used to correct the radiogenic ratio for the effects of mass fractionation. Unfortunately U (as well as Pb) does not possess a stable isotope pair and mass fractionation must be corrected using an external correction factor, by totally evaporating the sample4,6,7, or by using a double spike method2,5.
In the case of total evaporation, small residual mass biases can still exist at the 0.01% level. Analytical reproducibilty is ~0.02 to 0.03% 1RSD (0.2 to 0.3 per mil), which is too large to resolve terrestrial variations.
The alternative is to use a double “spike” of known isotopic composition to correct for mass fractionation. For example a 233U/236U double spike has been shown to correct 235U/238U to a precision of 0.02% 2RSD5 .
This work uses 234U/238U to fractionation correct 235U/238U in SRM U500 in a series of measurements on a Phoenix Thermal Ionization mass spectrometer. This is the reverse of the traditional method where the major isotopes 235U/238U are used to fractionation correct 234U/238U and 236U/238U6 .
Method
2 micrograms of SRM U500 was loaded on one side filament of a triple rhenium filament assembly. Following ion focussing an ion beam of 2e-11 A was maintained during the analysis. Data was collected in the static mode in ten blocks of twenty, 10 second integrations. The sample was not analysed to exhaustion.
Results
- Mass Fractionation during analysis and fractionation correction using 234U/238U.
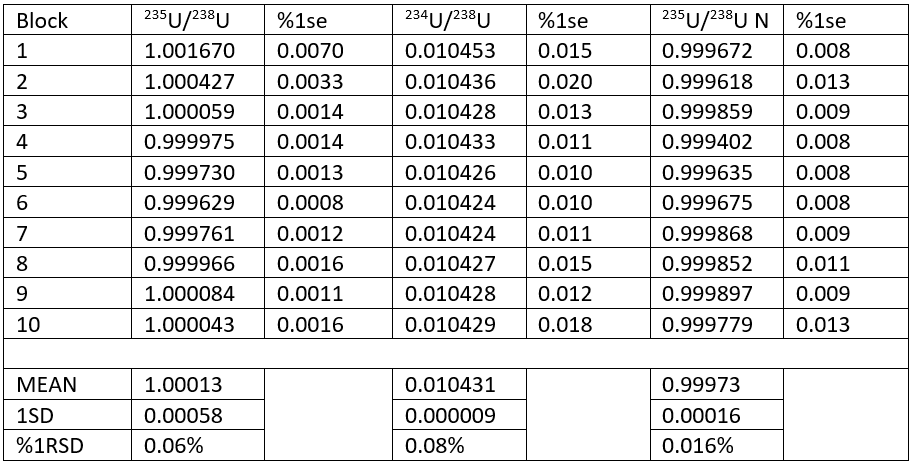
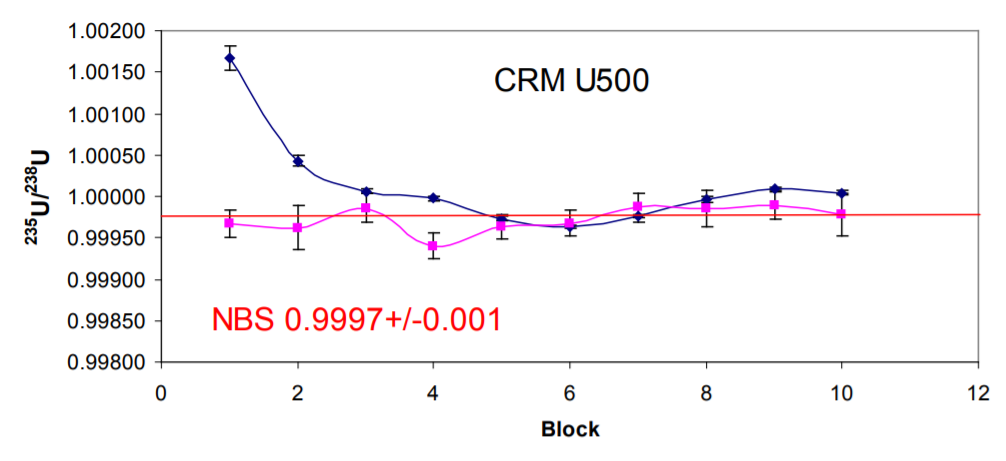
The results for one analysis are shown in Table 1. During the analysis the 235U/238U ratio reduces as would be expected (see also Figure 1). The ratio approximates the NBS value of 0.9997 by the 5th block. The precision of each block also improves to between 10 and 20ppm 1rse.
The 234U/238U data also shows a reduction in ratio after the first 2 blocks of data. The precision of each block of data is approximately 0.015%. This precision is entirely consistent with counting statistics. For example the 234U ion beam is 2 x 10-13 A (20mV). The noise associated with a 0.015% error (0.06% 1RSD) on a 20mV ion beam is: 2×10-13 x 0.0006 = 1.2 x 10⁻¹⁶ A, which is the equivalent to the noise level of 1e11 ohm resistor for a 10 second integration.
We can use the 234U/238U ratio to fractionation correct the 235U/238U. This is shown in Table 1 (235U/238U N column) and Figure 1 (pink line). A value of 0.010425 was taken as the reference ratio6 , and using an exponential correction a mean ratio of 0.99973 +/- 0.016% 1RSD is obtained for the 10 blocks of data. This is identical to the certified value. The precision is 4 times better than the uncorrected 235U/238U (1.00013+/- 0.06%). The precision of each block of the normalized data is worse than the raw ratio, because the largest source of error is the precision of the 234U/238U ratio, i.e. the counting statistics on the 234U measurement.
- Robustness of this method.
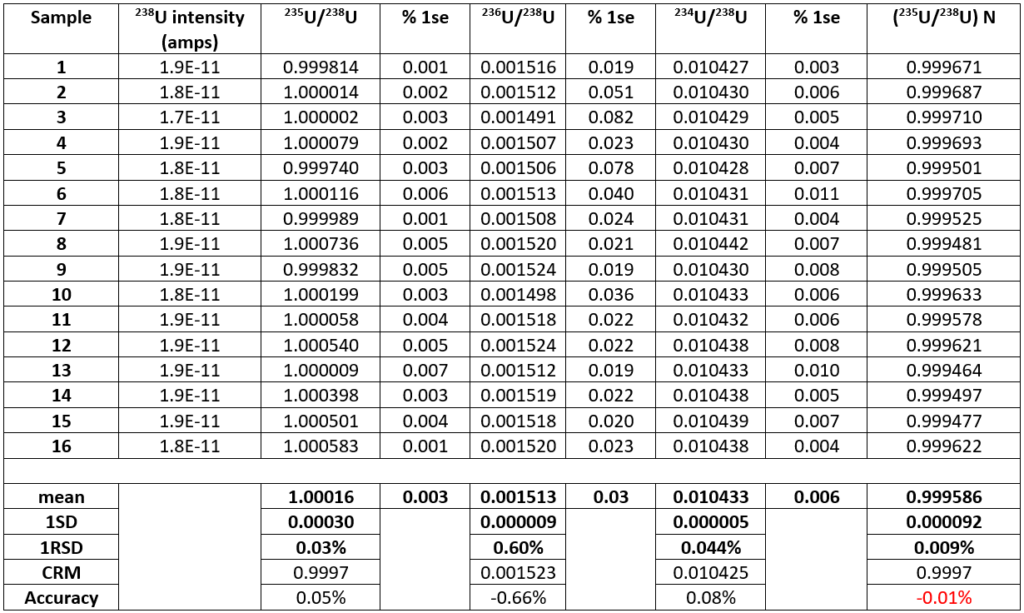
Table 2 shows the results of 16 analyses of U500 using the same analysis protocol. For each analysis the data are presented as the mean of each 200 ratio analysis and the errors are the percentage standard error. For the 16 different filaments the mean 235U/238U without fractionation correction is 1.00016 +/- 0.03%. This is higher than the certified value of 0.9997. The data is comparable to total evaporation data on 500ng loads which gave a ratio of 1.00014 +/-0.02%7
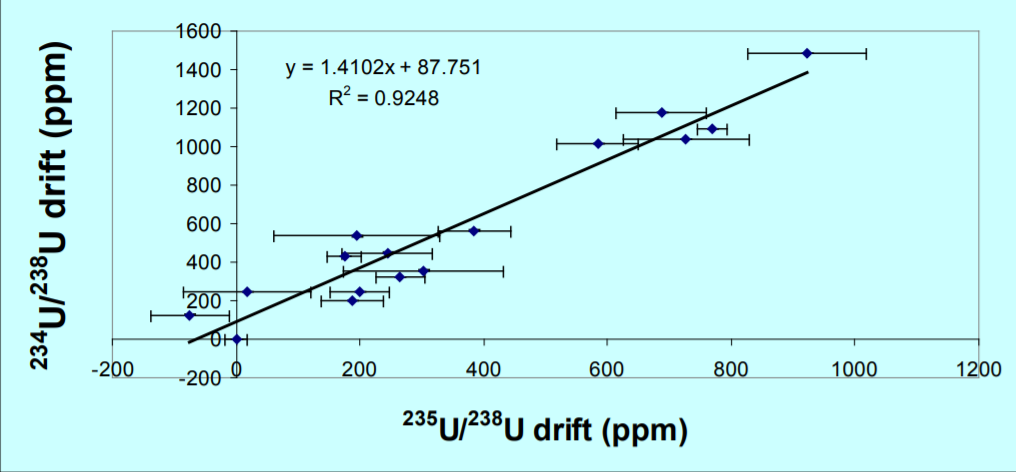
Figure 2, is a plot of 235U/238U and 234U/238U expressed as a ppm variation in the isotope ratio with the first measurement as the reference. A mass dependent fractionation would define a linear array with a slope of 1.33. The data define a linear array with a slope of 1.4 which is within error of this value, consequently 234U/238U can accurately correct the 235U/238U, despite the two orders of magnitude difference in isotope abundance between 234Uand 238U. The fractionation corrected 235U/238U is 0.999586+/-0.009% 1RSD. The ratio is slightly lower than the certified value but is more precise by an order of magnitude than the certification (0.1%). An improvement in precision by a factor of 3 over the uncorrected data is achieved, and an accuracy relative to the certificate of 0.01%.
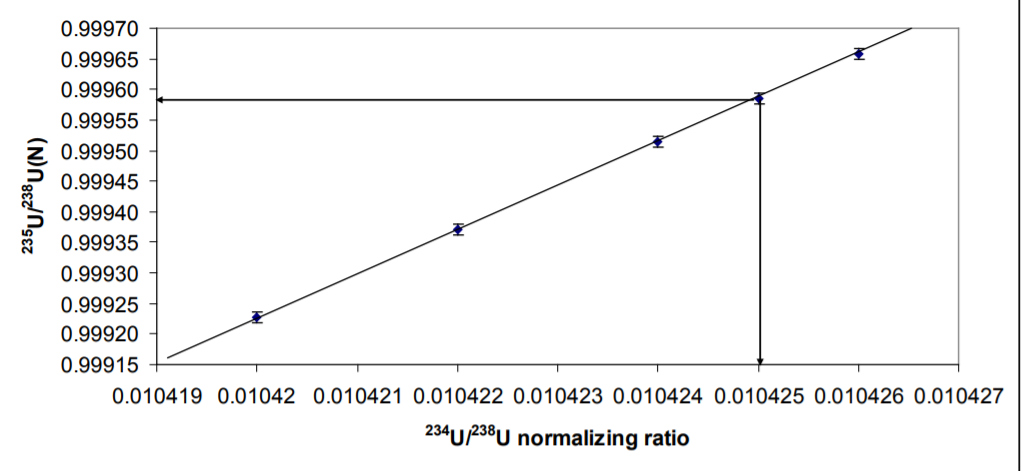
Figure 3 shows what happens to the 235U/238U with different values of the normalizing ratio. There is a linear relationship between 235U/238U N and the 234U/238U ratio chosen as the normalizing ratio. In this work a 234U/238U of 0.010425 (Richter et. al. 2011) yields 235U/238N of 0.999584+/-0.00018 2RSD. Using the certified value of 234U/238U 0.010422 would result in a 235U/238U of 0.99937 which is not within error of the certified value. The data would therefore support the 234U/238U of Richter et. al 2011 as being correct, though a ratio of 0.0104265 would yield the precise value of the CRM 235U/238U of 0.9997
- Comparison with isotopic composition determined with double spike
Condon et. al 20105 used IRMM 3636 (233U-236U) double spike to measure 235U/238U in CRM U500 from two different laboratories and two different TIMS instruments. The 235U/238U was 1.00022+/-0.00016 2RSD. Our uncorrected values of 1.00016+/-0.00060 2RSD is identical within error to this, though both are within error of the CRM (+/-0.1%).
There appears to be a significant difference between the double spiked value of 1.00022+/-0.00016 and our value of 0.99958+/-0.00018.
One possible reason for this could be that peak tailing from 235U on our measurements could result in an over correction of the 234U, (lower 234U/238U). This can be rejected as the abundance sensitivity at -1amu was <2ppm of the major isotope. For a 2e-11 A ion beam the uncorrected peak tail of 235U on 234U would be 4e-17 A which is less than the Faraday noise for a 10 second integration. A lower measured 234U/238U would result in a normalized 235U/238U which was higher than 0.99958.
An interference under the 234U or uncorrected peak tail, would result in a higher measured 234U/238U, producing a larger correction and hence a lower 235U/238U. This can be rejected because the measurements were made over several filaments and Figure 2 shows a significant correlation without outliers.
Our data are consistent with those of Richter et.al. 2011. We therefore do not understand at the moment why the double spiked data is different from our data.
Conclusions
- Internal mass fractionation correction of 235U/238U in NBS U500 using 234U/238U=0.010425 improves the precision of 235U/238U by a factor of 3 to <0.01% 1RSD, despite the large 234U/238U
- The 235U/238U = 0.999586 is within 0.01% of the certificate value of 0.99968.
Download Application Note
Download the complete Application Note: Mass Fractionation behaviour of U