Zenon Palacz, Davydd Wanless, Ian Turner & Tony Jones. Isotopx Ltd. UK
Introduction
We have analysed CRM U500 on the Phoenix TIMS using Faraday collectors equipped with Xact amplifier boards carrying 1e11 Ω resistors and 1e12 Ω (1T Ω) resistors. The 1T Ω resistors should in theory offer three times less noise than the 1e11 Ω resistors and this should result in a higher precision for smaller ion beams.
Noise level
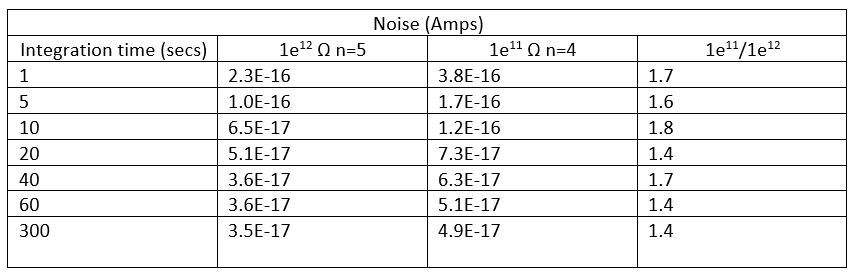
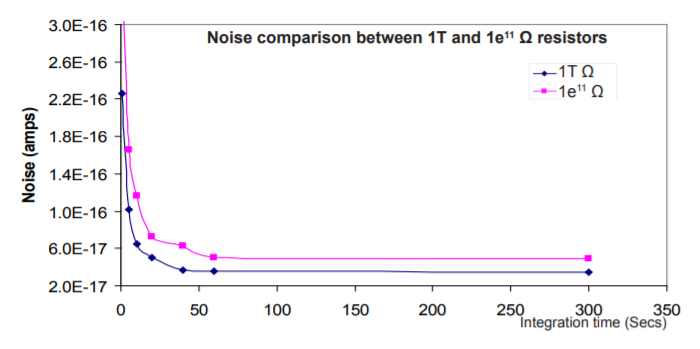
Table 1 and Figure 1 show the noise levels of 1e11 Ω and 1T resistors in the same amplifier housing. Temperature conditions are the same, as the housing is Peltier cooled to 16o C and evacuated using a scroll pump. The 1e11 Ω resistor noise decreases with increasing integration time. This has been demonstrated in Technical note G10712 which also showed that the noise for 1e11 Ω resistors, closely followed the theoretical Johnson Noise. The 1T resistors show lower noise than the 1e11 Ω resistors irrespective of the integration time. However, the noise levels are not three times better than the 1e11 Ω resistors. Typically the noise is better by a factor of 1.5, though the difference is more pronounced for shorter integration times.
This lower than expected improvement in noise has also been reported by Richter et. al 2011 on a different TIMS instrument. For a typical integration time of 10 seconds the noise level on 1T resistors is 6.5e-17 A which can be achieved on 1e11 Ω resistors if the noise is integrated for 40 seconds or more. This would mean that at least four 10-second integrations can be made with 1T resistors at the same noise level as one 40-second integration with 1e11 Ω resistor.
1T and 1e11 Ω Resistor Time Response (Tau)
In the past 1T resistors have demonstrated an extremely slow time response, i.e the time taken for a signal to decay to baseline can be several tens of seconds. Richter et. al 2011, state an idle time of 15 seconds is required before data is collected following a mass jump. This would clearly make measurements involving peak jumping prohibitively slow, especially for small samples.
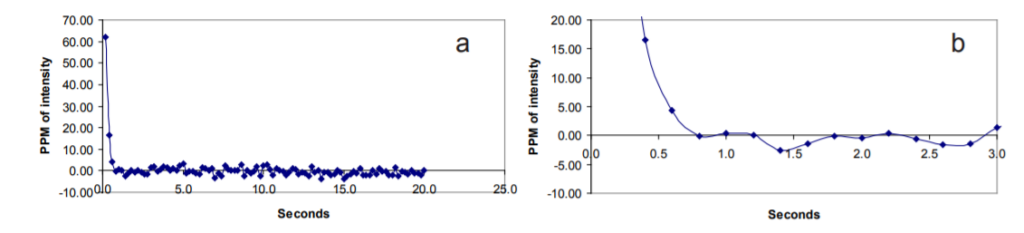
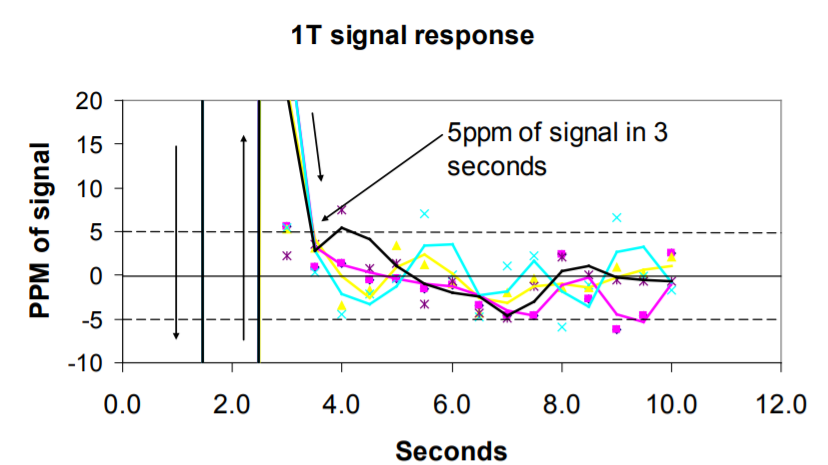
Figure 2 shows the resistor response for a standard 1e11 Ω resistor, and shows that baseline can be achieved in about one second. Figure 3 shows the tau trace for four 1T resistors. Baseline is achieved between three and four seconds, so they are approximately three times slower than 1e11 Ω resistors. This has also been noted by Tuttas et. al.20073 .
CRM U500
The CRM U500 is particularly useful in demonstrating the performance difference between the two types of resistors.
The major isotopes are equivalent in size (235U/238U= 0.9997) and can be used to fractionation correct the minor isotope ratios 234U/238U and 236U/238U whose ratios are 0.010425 and 0.001522 respectively1 . This large dynamic range in minor/ major isotope ratio of two and three orders of magnitude are good indicators of the ability to measure small ion signals.
Method
2µg loads of U500 were loaded on degassed triple filament assemblies. During analysis the ion signal was maintained at 6.5 e-12 A equivalent to 650mv using a 1e11 Ω resistor. The relatively low intensity used for these analyses was used to compare the performance of the two types of resistors to analyze small ion beams.
Data was collected in the static mode. A total of 400 ten second integrations were made, in 20 blocks of 20 cycles. Baselines were taken at the start of each block at +/- 0.5amu for 30 seconds at each mass position. A four second delay was made following each mass jump before integrating the signal or baseline as this is the length of time for the signal to reach baseline with the 1T resistors.
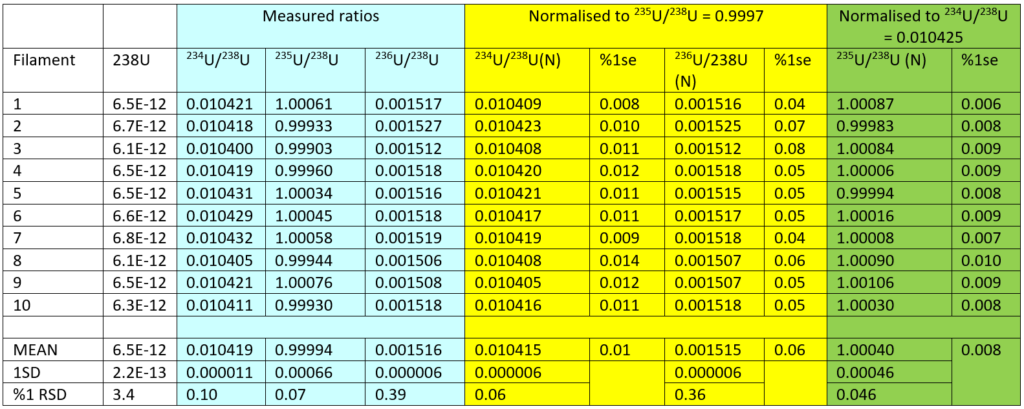
1e11 Ω CRM U500 Faraday data
The Data for 1e11 Ω are shown in Table 2. The columns in blue are the measured isotope compositions. The mean 234U/238U is 0.010419+/-0.1%, the mean 235U/238U is 0.99994+/-0.07% and the mean 236U/238U is 0.001516+/-0.39%. As expected the precision gets worse with the involvement of the smaller ion beam, however, there remains an element of non-corrected mass fractionation which means that the reproducibility of the 234U/238U is similar to the 235U/238U. The mass fractionation effect can be overcome if the 234U/238U and 236U/238U are fractionation corrected with 235U/238U. This is shown in the yellow columns.
The average internal precision (%1se) of 234U/238U is 0.01%, and 236U/238U 0.06%. This is consistent with the 236U being 6 times smaller than the 234U. The reproducibility for the 234U/238U at 0.06% is also six times better than the 0.36% for the 236U/238U. We can use the 234U/238U to fractionation correct the 235U/238U and a mean ratio of 1.0004+/-0.046% 1RSD is obtained, this is shown in the green columns. The reproducibility for the 235U/238U is a factor of two larger than the individual measurement precision.
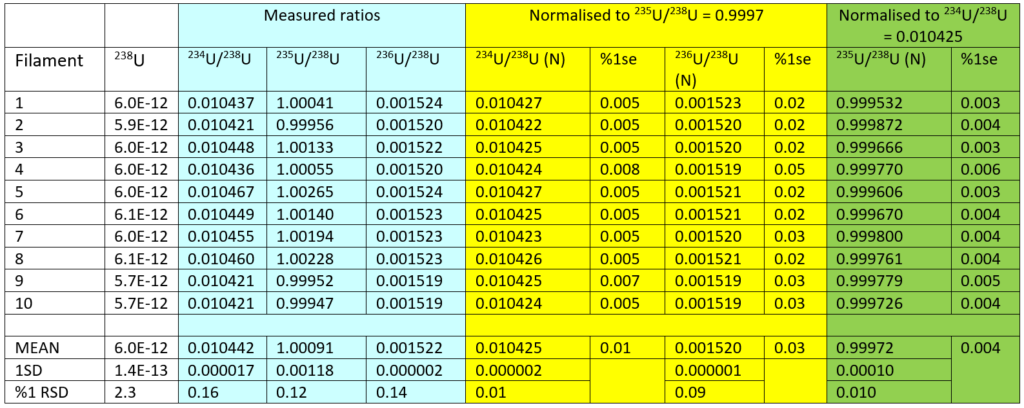
1T Ω CRM U500 Faraday data
Data for amplifier boards fitted with 1T resistors are shown in Table 3. For the non-fractionation corrected ratios, the mean 234U/238U is 0.010442+/-0.16%, the mean 235U/238U is 1.00091+/-0.12% and the mean 236U/238U is 0.001522+/-0.14%. Reproducibilities are all the same unlike the 1e11 Ω data. There is however a startling improvement in the fractionation corrected data shown in the yellow columns. 234U/238U is 0.010425+/-0.01% and 236U/238U is 0.001520+/-0.09%. This indicates that the fractionation correction has improved the data by more than an order of magnitude. The normalised 235U/238U has a mean ratio of 0.99972+/-0.01% 1RSD shown in the green columns. The reproducibility for the 235U/238U is a factor of two larger than the individual measurement precisions, and is an order of magnitude better than the uncorrected data.
Comparison between 1T and 1e11 Ω.
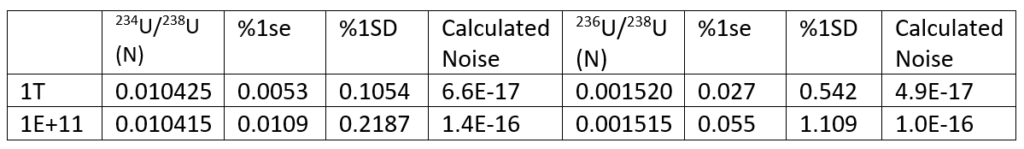
The isotope data show that there is no difference in isotope composition or precision between the 1T and the 1e11 Ω resistors for the un-normalized data sets. This is surprising considering that the minor isotope intensities 234U and 236U are only 6e-14 A and 1e-14 A respectively. The biggest source of error appears to be the fractionation behaviour on the filament. For the normalized ratios the 234U/238U and 236U/238U individual analysis precision is improved by a factor of two with the 1T resistors (Table 4).
Table 4 summarizes the normalized 234U/238U and 236U/238U data for individual analyses. We can calculate the resistor noise by taking the intensity of the minor isotopes and dividing it by the standard deviation of the error. In this case the standard deviation is the standard error multiplied by 20, where 20 is the square root of the number of ratios, which in this case is 400. The noise is approximately 6e-17 A for the 1T resistor and 1.2e-16 A for the 1e11 Ω resistor. This is consistent with the measured noise for a 10 second integration shown in Table 1.
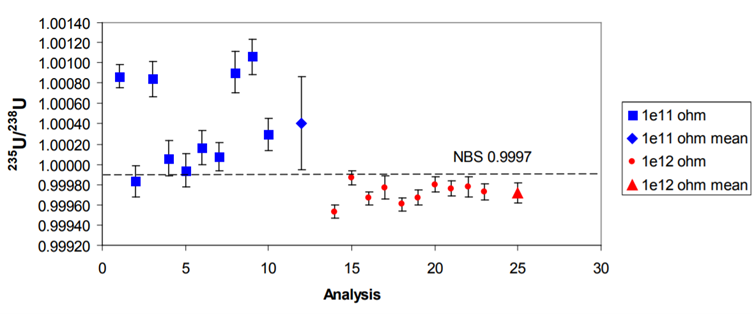
The reproducibility is better with the 1T resistors by a factor of 6 for the 234U/238U and by a factor of 4 with the 236U/238U. The 235U/238U internal precision is improved by a factor of two while the reproducibility is improved by a factor of 4.5 (Figure 3).
Conclusion
- 1T resistors are between 1.5 and 2 times quieter than 1e11 Ω resistors for the same integration time.
- The 1T resistors are approximately 3 times slower than the 1e11 Ω resistors and they reach baseline in 3-4 seconds.
- There is no difference between the two resistor types for non-fractionation corrected data. Fractionation corrected data shows a factor of 2 increase in precision for ratios involving the minor uranium isotopes.
- Reproducibility is dramatically improved by at least a factor of 5 with the 1T resistors
References
- Richter, S., Kuhn, H., Aregbe, Y., Hedberg., Horta-Domenech., Mayer K., Zuleger E., Burger S., Boulyga S., Kopf A., Poths J., Mathew K. 2011 Improvements in routine uranium isotope ratio measurements using the modified total evaporation method for multi-collector thermal ionization mass spectrometry. J.Anal At. Spectrom, 2011, 26, 550-564.
- Palacz Z, Wanless D. 2012. Mass Fractionation behaviour of U isotopes during Thermal Ionization, the potential for mass fractionation correction using double spike. Isotopx Application note G10712.
- Dietmar Tuttas, Johannes Schwieters, Norbert Quaas, Claudia Bouman, 2007. Thermo Fisher Scientific, Bremen, Germany Improvements in TIMS High Precision Isotope Ratio Measurements for sample sizes. Triton Application Note 30136.
Download Technical Note
Download the complete Technical Note: Comparative analytical performance of 1e11 Ω and 1T (1e12 Ω) resistors on Phoenix